
Collect events from RudderStack
Start collecting events from RudderStack via webhook.
 View as Markdown
Using a webhook destination, RudderStack continuously delivers event data to Krenalis in real time. This integration unifies your tracking across sources and ensures that every event is structured, reliable, and ready for analytics or activation.
How it works
- Create a webhook destination in RudderStack. Configure RudderStack to send all events to Krenalis in real time.
- Filter received events in Krenalis. Optionally define filters that run before processing so only selected events are processed and stored.
- Load events into your warehouse. Krenalis ingests the filtered events and stores them in your workspace warehouse for unification and analysis.
- Use events in Krenalis Activation. Use the stored events within Krenalis Activation to build audiences, trigger automations, and sync data to external destinations.
Steps
If you've already added a source connection for the same RudderStack account, you can reuse it and start with the Debug the events step.
1. Connect Krenalis with RudderStack
- In your Krenalis workspace, open the Sources page.
- Click Add a new source ⊕, then select the RudderStack card.
- Click Add source....
- Click Add to complete the connection.
- On the connection page, click Settings → Event write keys and copy the event write key and the endpoint URL
2. Add a webhook on RudderStack dashboard
Then proceed to create a webhook destination in RudderStack:
-
From the RudderStack dashboard, go to Collect → Destinations.
-
Click New destination, search for Webhook, then select it.
-
Enter a name for the destination to easily recognize it later and click Continue.
-
Select the sources whose events you want to send to Krenalis and click Continue.
-
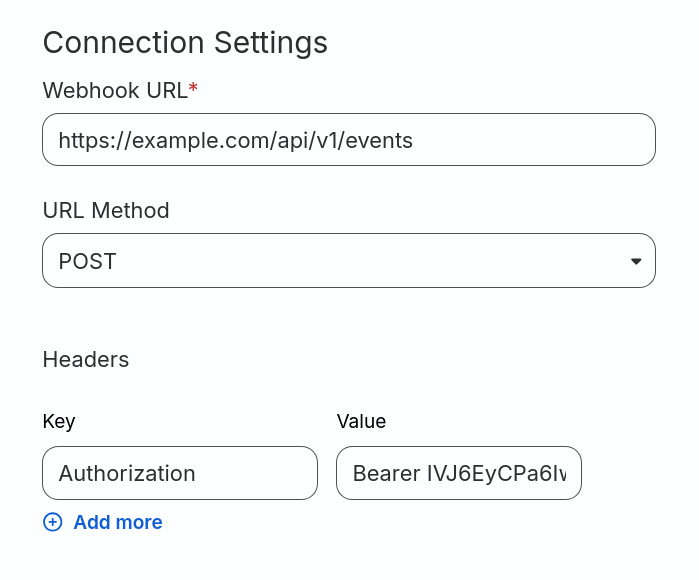
Set:
Field Value webhook URL The endpoint copied earlier. URL Method POSTBatch Size 500Headers Key AuthorizationHeaders Value Bearer EVENT_WRITE_KEY, whereEVENT_WRITE_KEYis the write key you copied earlier.Refer to the following screen:
-
Click Continue to create the destination.
3. Debug the events
Use the Event debugger in your source connection in the Krenalis Admin console to verify that events are received correctly.
-
In Krenalis, open your source connection.
-
Go to the Event debugger tab.
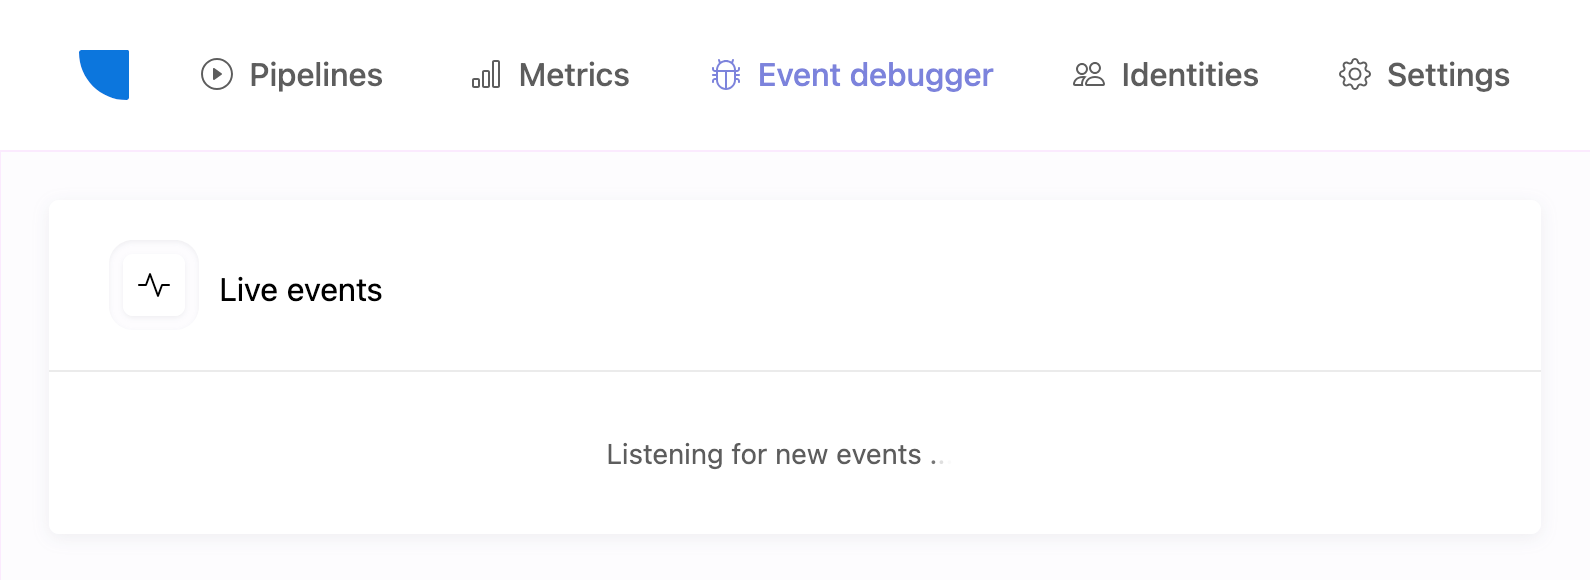
It shows a live sample of the most recent events received for this source connection. Use it whenever you need to quickly confirm that events are arriving as expected and to inspect their contents in real time.
-
Generate an
identifyevent in RudderStack. The event should appear within a few seconds: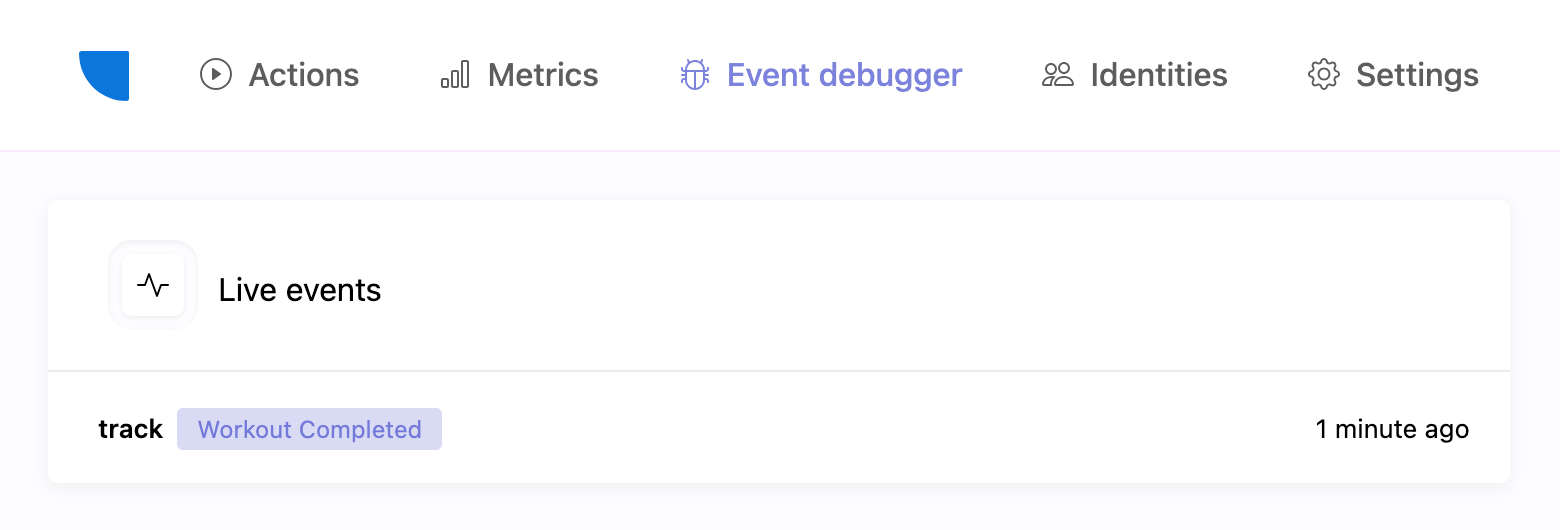
-
Click the collected event in the Event debugger list to view its JSON payload, which contains the data sent by RudderStack.
The following example shows what a typical event payload looks like:
{
    "anonymousId": "b27c5d9f-92a7-4d30-b21a-4df21a6872c2",
    "context": {
        "browser": {
            "name": "Safari",
            "version": "17.2.1"
        },
        "ip": "172.91.24.57",
        "library": {
            "name": "krenalis.js",
            "version": "1.0.0"
        },
        "locale": "en-US",
        "os": {
            "name": "macOS",
            "version": "14.5"
        },
        "page": {
            "path": "/dashboard",
            "title": "User Dashboard",
            "url": "https://app.example.com/dashboard"
        },
        "screen": {
            "width": 3024,
            "height": 1964,
            "density": 2
        },
        "session": {
            "id": "1766272512048"
        },
        "timezone": "America/Los_Angeles",
        "userAgent": "Mozilla/5.0 (Macintosh; Intel Mac OS X 14_5) AppleWebKit/605.1.15 (KHTML, like Gecko) Version/17.2.1 Safari/605.1.15"
    },
    "event": "Workout Completed",
    "messageId": "f9189a52-b37b-4d7d-9f2d-08b91d85fa9c",
    "properties": {
        "workout_type": "Cardio",
        "duration_minutes": 45,
        "calories_burned": 380,
        "device": "Smartwatch"
    },
    "receivedAt": "2025-10-20T16:15:24.340Z",
    "sentAt": "2025-10-20T16:15:24.327Z",
    "originalTimestamp": "2025-10-20T16:15:23.992Z",
    "timestamp": "2025-10-20T16:15:24.010Z",
    "type": "track",
    "userId": "703991475"
}
If no event appears after a few seconds:
- Check your application logs for errors.
- Ensure your event write key and endpoint are correct.
💡 See the Event spec for full details on the event schema.
4. Add a pipeline to import events
- Click on the Pipelines tab of the connection for RudderStack.
- Next to the Import events into warehouse pipeline, click Add pipeline....
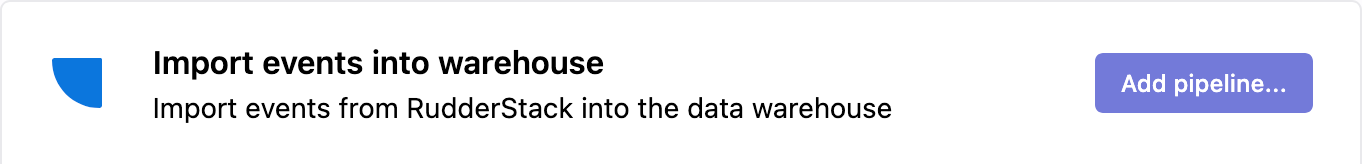
This is an "Import events" pipeline type, which transfers events received from RudderStack into your warehouse.
Each pipeline defines how and when events flow from RudderStack into the warehouse. You can add multiple pipelines per connection to handle different data segments or destinations.
5. Filter events
If you don't want to import all events from RudderStack, use a filter in Krenalis to determine which received events are imported into the warehouse. If no filter is set, all events from RudderStack will be imported. For more information on how to use filters, see the Filters documentation.
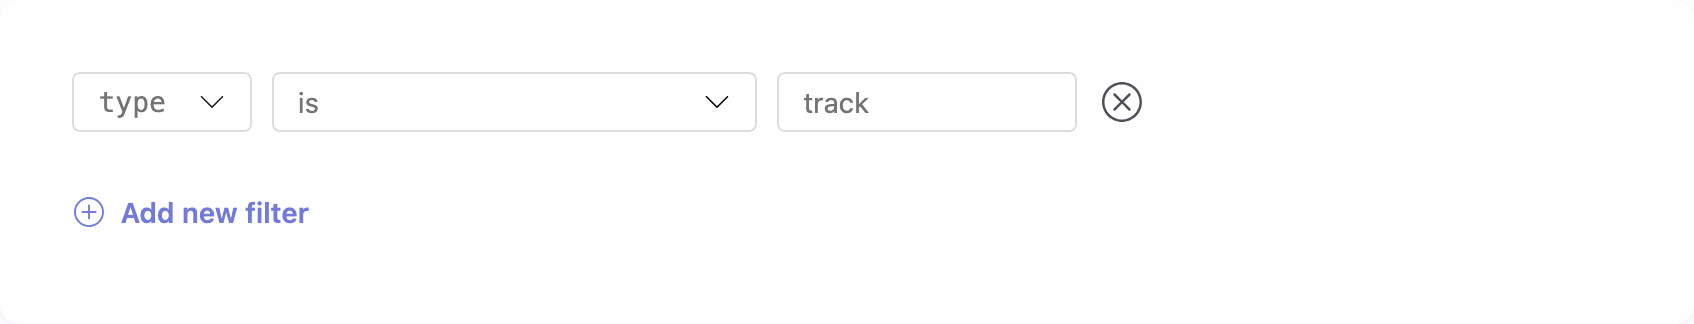
In the example above, only track events are imported.
6. Save your changes
When you're done, click Add (or Save if you're editing an existing pipeline).
The new pipeline will appear in your source connection and can be edited or disabled at any time.
Pipelines
Once saved, the new pipeline appears in the pipelines list for RudderStack. From here, you can monitor imports and adjust filters. Each pipeline defines how and when events flow from RudderStack into your warehouse.
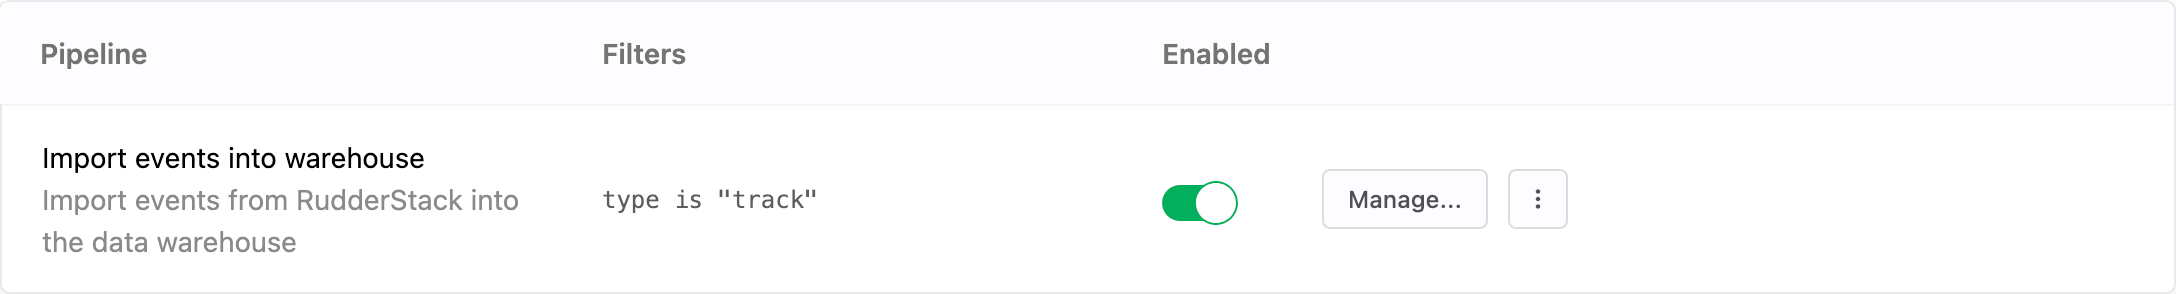
| Column | Description |
|---|---|
| Pipeline | Name and description of the pipeline. |
| Filter | Condition that determines which events are processed. If not set, all events are included. |
| Enable | Switch to activate or deactivate the pipeline. When disabled, no events are processed. |
| Manage | Edit settings such as filter. |
| ⋮ (More) | Additional options, such as deleting the pipeline. |